Body text
The Energetic Particle Telescope
Electron flux variations for E>500 keV during geomagnetic storms are investigated using the Energetic Particle Telescope (EPT). This detector launched in May 2013 on board the satellite PROBA‐V at an altitude of 820 km was designed by BIRA-IASB, UCLouvain and QinetiQ Space to provide uncontaminated spectra of:
- electrons
- protons
- alpha particles
Geomagnetic storms
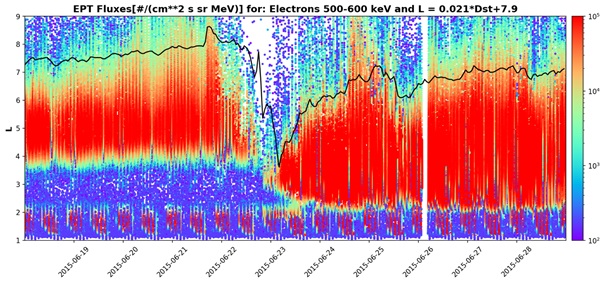
Electron flux dropout events are observed during the main phase of each storm and even during substorms: a rapid reduction of the electron flux is noted throughout the outer electron radiation belt at all energies above about 0,5 MeV on timescales of a few hours.
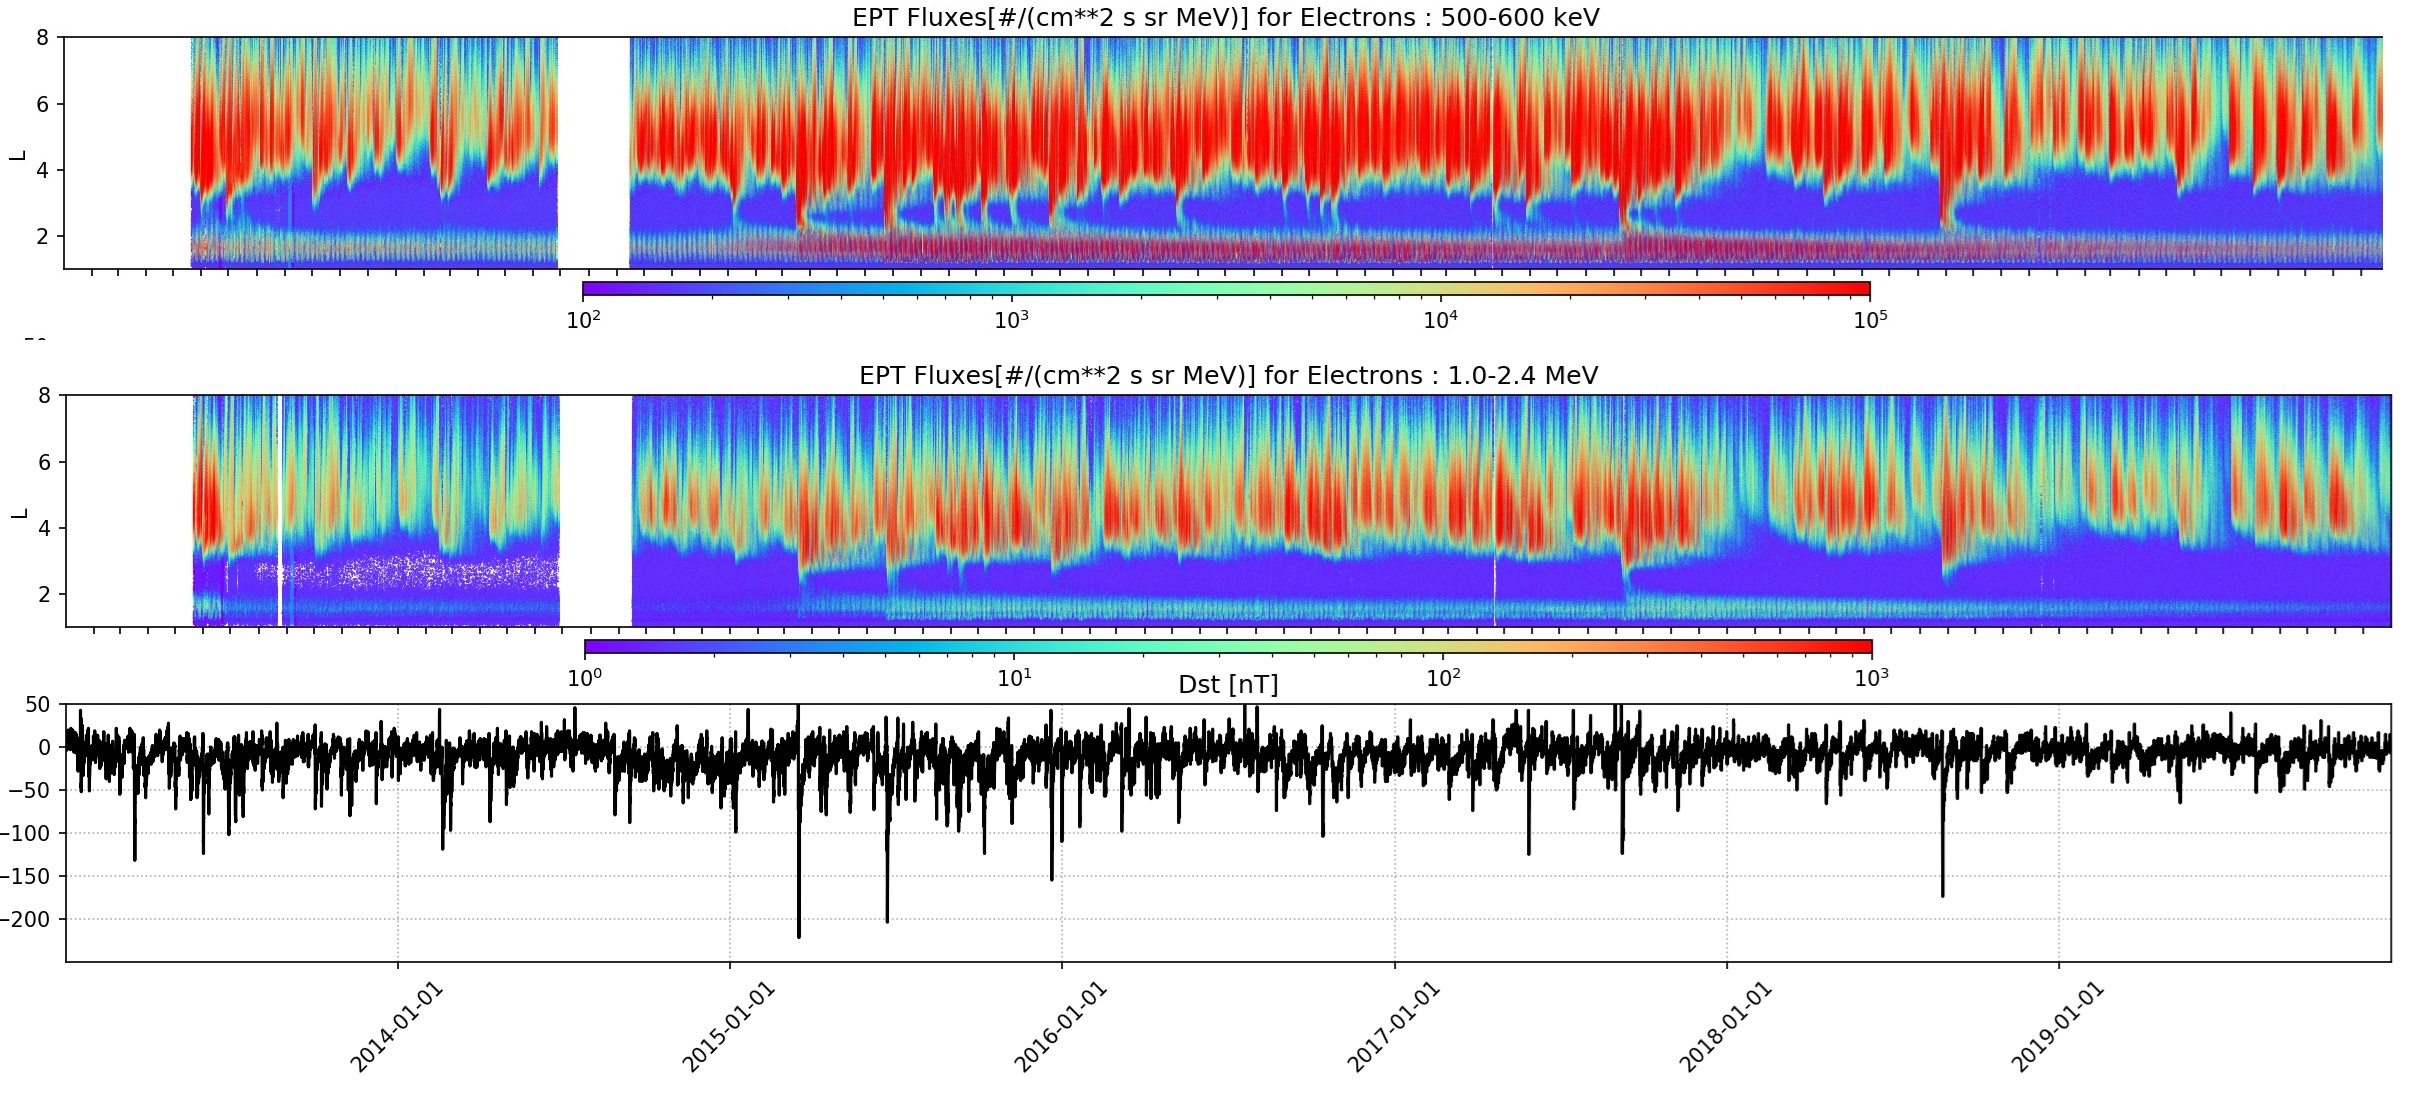
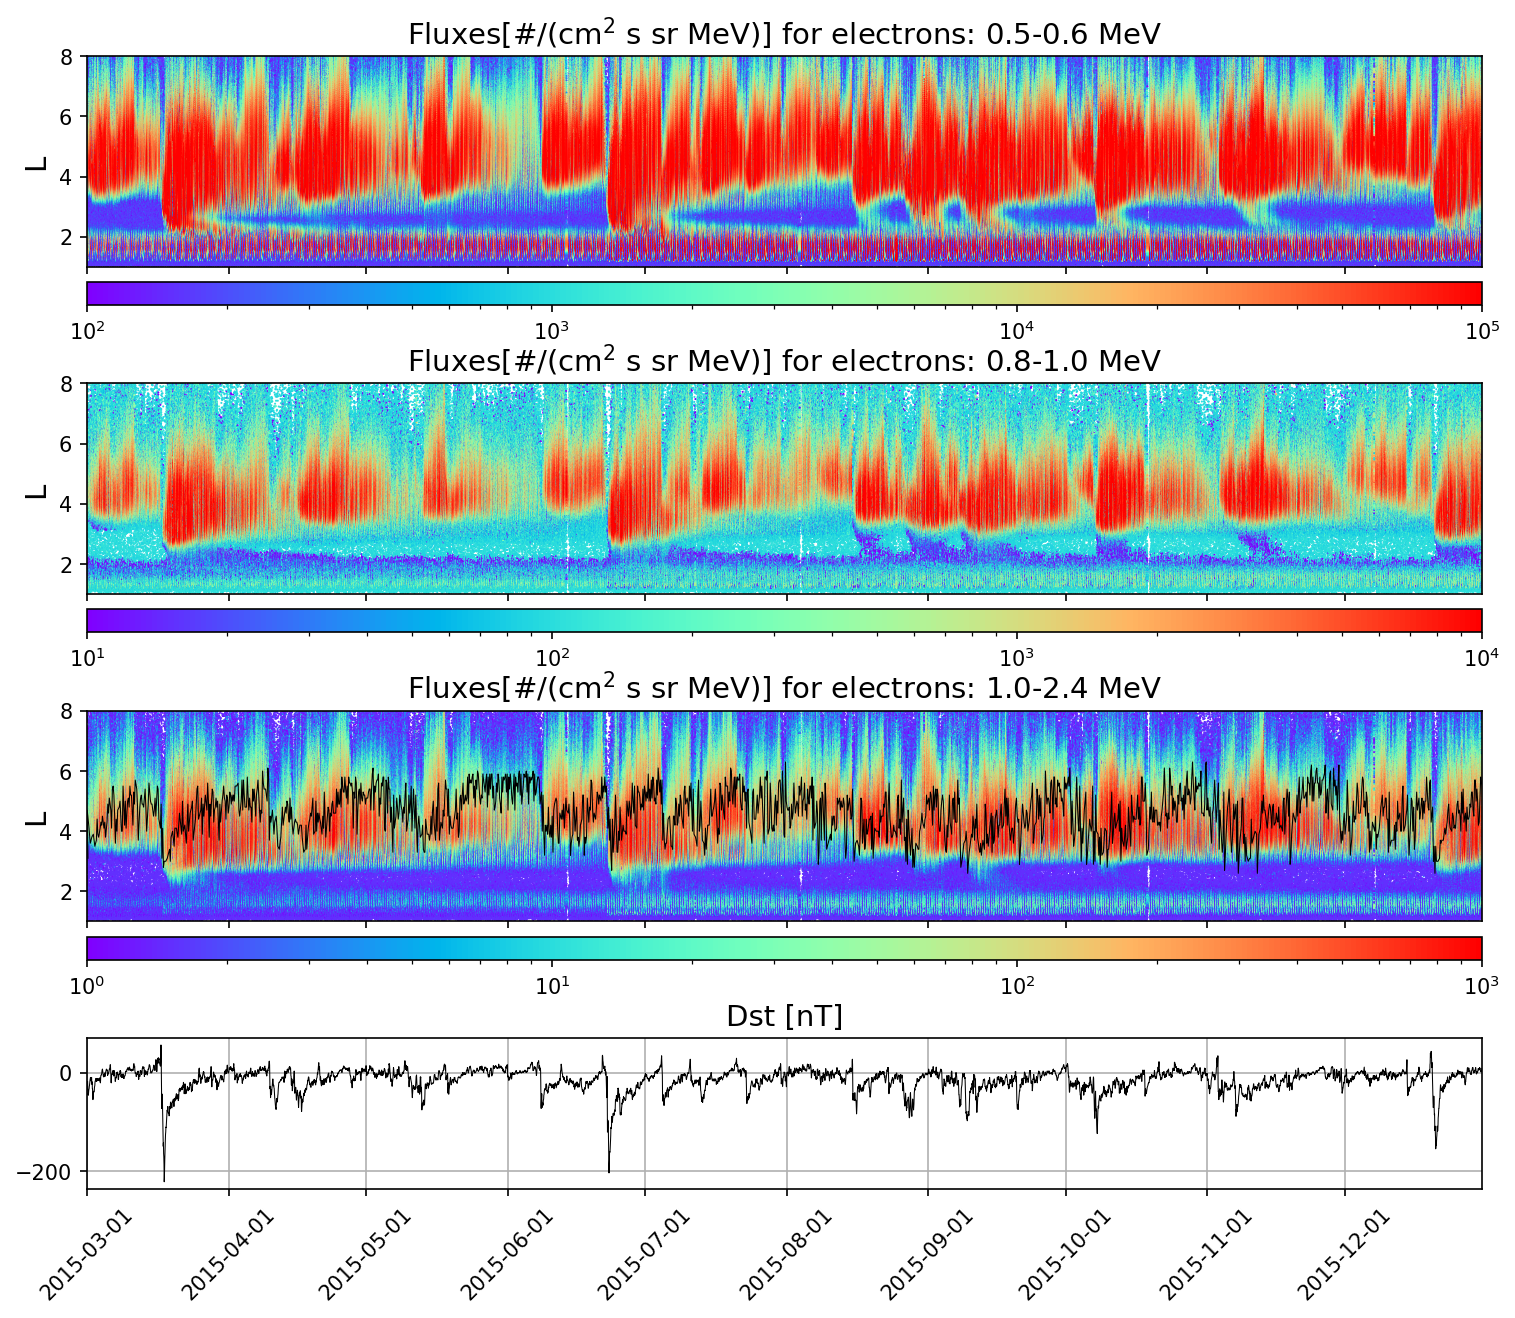
The electron spectrograms measured by EPT between 2013 and 2019 show that after each geomagnetic storm, dropout events are followed by a flux enhancement starting first at low L values, and reaching the slot or even the inner belt for the strongest storms. L is the equatorial distance parameter of the magnetic shells, expressed in Earth radii. The outer radiation belt is typically located at L > 4, the inner belt at L < 2 Earth radii, and the region between corresponds to the slot region.
We can see that dropouts appear at all energies measured by EPT and penetrate down to L∼3.5 Earth radii for the strongest events. Dropouts are observed each time Dst has an inverted peak < ‐40 nT.
Flux enhancements appear at lower L only for big storm events with Dst < ‐50 nT. They penetrate down to an impenetrable barrier with a minimum L‐shell related to Dst and to the energy. For E > 2 MeV, this limit is always higher than the inner belt and it is linked to the plasmapause position corresponding to the sharp limit of cold plasma. We showed also that the plasmapause is related to auroral spots.
Human activity also influences electron fluxes of the radiation belts: we demonstrated that the ground-based transmitter in northwest Australia scatters electrons and make them lost from the radiation belts.
Further reading
- Pierrard, V., Botek, E., Ripoll, J.-F., and Cunningham, G.S. (2020). Electron dropout events and flux enhancements associated with geomagnetic storms observed by PROBA-V/EPT from 2013 to 2019. Journal of Geophysical Research: Space Physics, 125(12), e2020JA028487. https://doi.org/10.1029/2020JA028487

- Pierrard, V., Lopez Rosson, G., and Botek, E. (2019). Dynamics of Megaelectron Volt Electrons Observed in the Inner Belt by PROBA-V/EPT. Journal of Geophysical Research: Space Physics, 124(3), 1651-1659. https://doi.org/10.1029/2018JA026289
- Cunningham, G.S., Botek, E., Pierrard, V., Cully, C., and Ripoll, J.-F. (2020). Observation of High-Energy Electrons Precipitated by NWC Transmitter from PROBA-V Low-Earth Orbit Satellite. Geophysical Research Letters, 47(16), e2020GL089077. https://doi.org/10.1029/2020GL089077