Body text
The plasmasphere model
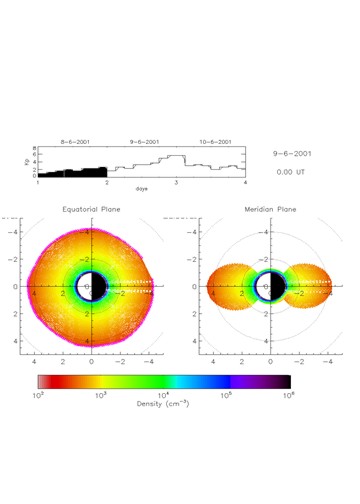
The 3-dimensional model of the plasmasphere coupled with the ionosphere developed by Pierrard and Voiculescu (2011) at BIRA-IASB is now provided on SSA website (space radiations, SPM model).
It shows in real time or for any chosen date:
- the equatorial and meridian view of the number density
- the temperatures of the particles in the plasmasphere
- the plasmapause position
Its results were compared with different satellite observations to validate the physical processes included in the model, especially the quasi-interchange instability mechanism of plasmapause formation.
Satellite observations
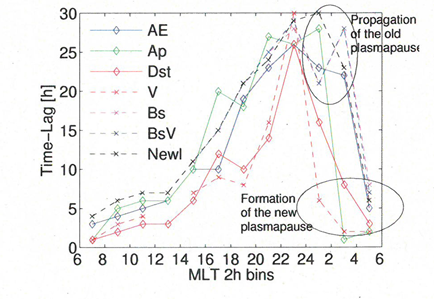
In addition to Cluster and CRRES satellite data, we analyzed THEMIS plasmapause observations (6840 measurements from 2008-2012) to determine their relations with solar wind and geomagnetic activity indices. We showed that the time-lag (in hours) of plasmapause formation is a function of the MLT sector and shows a regular increase, proving that the plasmapause is generated in the post-midnight sector and then transmitted to other MLT sector by co-rotation (Bandic et al., 2017).
This works for all geomagnetic activity indices like AE (Auroral Electrojet) or Dst (Disturbed Storm Time), and for solar wind parameters like the velocity of the solar wind V or the intensity of the interplanetary magnetic field Bs.
MAGION-5 observations were also used to study the thickness of the plasmasphere boundary layer and test its mechanism of formation.
Finally, the model was also used to study the effects of the solar eclipse on 20 March 2015 and the following geomagnetic storm (Stankov et al., 2017).
References
- Bandić, M., Verbanac, G., Pierrard, V., Cho, J. (2017). Evidence of MLT propagation of the plasmapause inferred from THEMIS data. Journal of Atmospheric and Solar-Terrestrial Physics, 161, 55–63. https://doi.org/10.1016/j.jastp.2017.05.005
- Kotova, G., Verigin, M., Lemaire, J., Pierrard, V., Bezrukikh, V., Smilauer, J. (2018). Experimental Study of the Plasmasphere Boundary Layer Using MAGION 5 Data. Journal of Geophysical Research: Space Physics, 123(2), 1251–1259. https://doi.org/10.1002/2017JA024590
- Stankov, S.M., Bergeot, N., Berghmans, D., Bolsée, D., Bruyninx, C., Chevalier, J.-M., Clette, F., De Backer, H., De Keyser, J., D’Huys, E., Dominique, M., Lemaire, J.F., Magdalenić, J., Marqué, C., Pereira, N., Pierrard, V., Sapundjiev, D., Seaton, D.B., Stegen, K., Van der Linden, R., Verhulst, T.G.W., West, M.J. (2017). Multi-instrument observations of the solar eclipse on 20 March 2015 and its effects on the ionosphere over Belgium and Europe. Journal of Space Weather and Space Climate, 7, A19. https://doi.org/10.1051/swsc/2017017

- Verbanac, G., Bandić, M., Pierrard, V., Cho, J. (2018). MLT Plasmapause Characteristics: Comparison Between THEMIS Observations and Numerical Simulations. Journal of Geophysical Research: Space Physics. https://doi.org/10.1002/2017JA024573