Body text
Building a homogenized ground-based data set from an international network
BIRA-IASB is very active in international networks of ground-based measurements. Among these is the Fourier Transform Infrared (FTIR) group of the Network for the Detection of Atmospheric Composition Change (NDACC), measuring many traces gases such as ozone, carbon monoxide, methane...
One of the main goals of ground-based measurements is to assess the quality of satellite data. It is crucial to perform this satellite validation at different places over the world to ensure that the satellite data are of good quality under different atmospheric and sensing conditions. Furthermore, to obtain robust validation assessments, the ground-based data must be harmonized among the network stations, to become a reference data set with internal consistency.
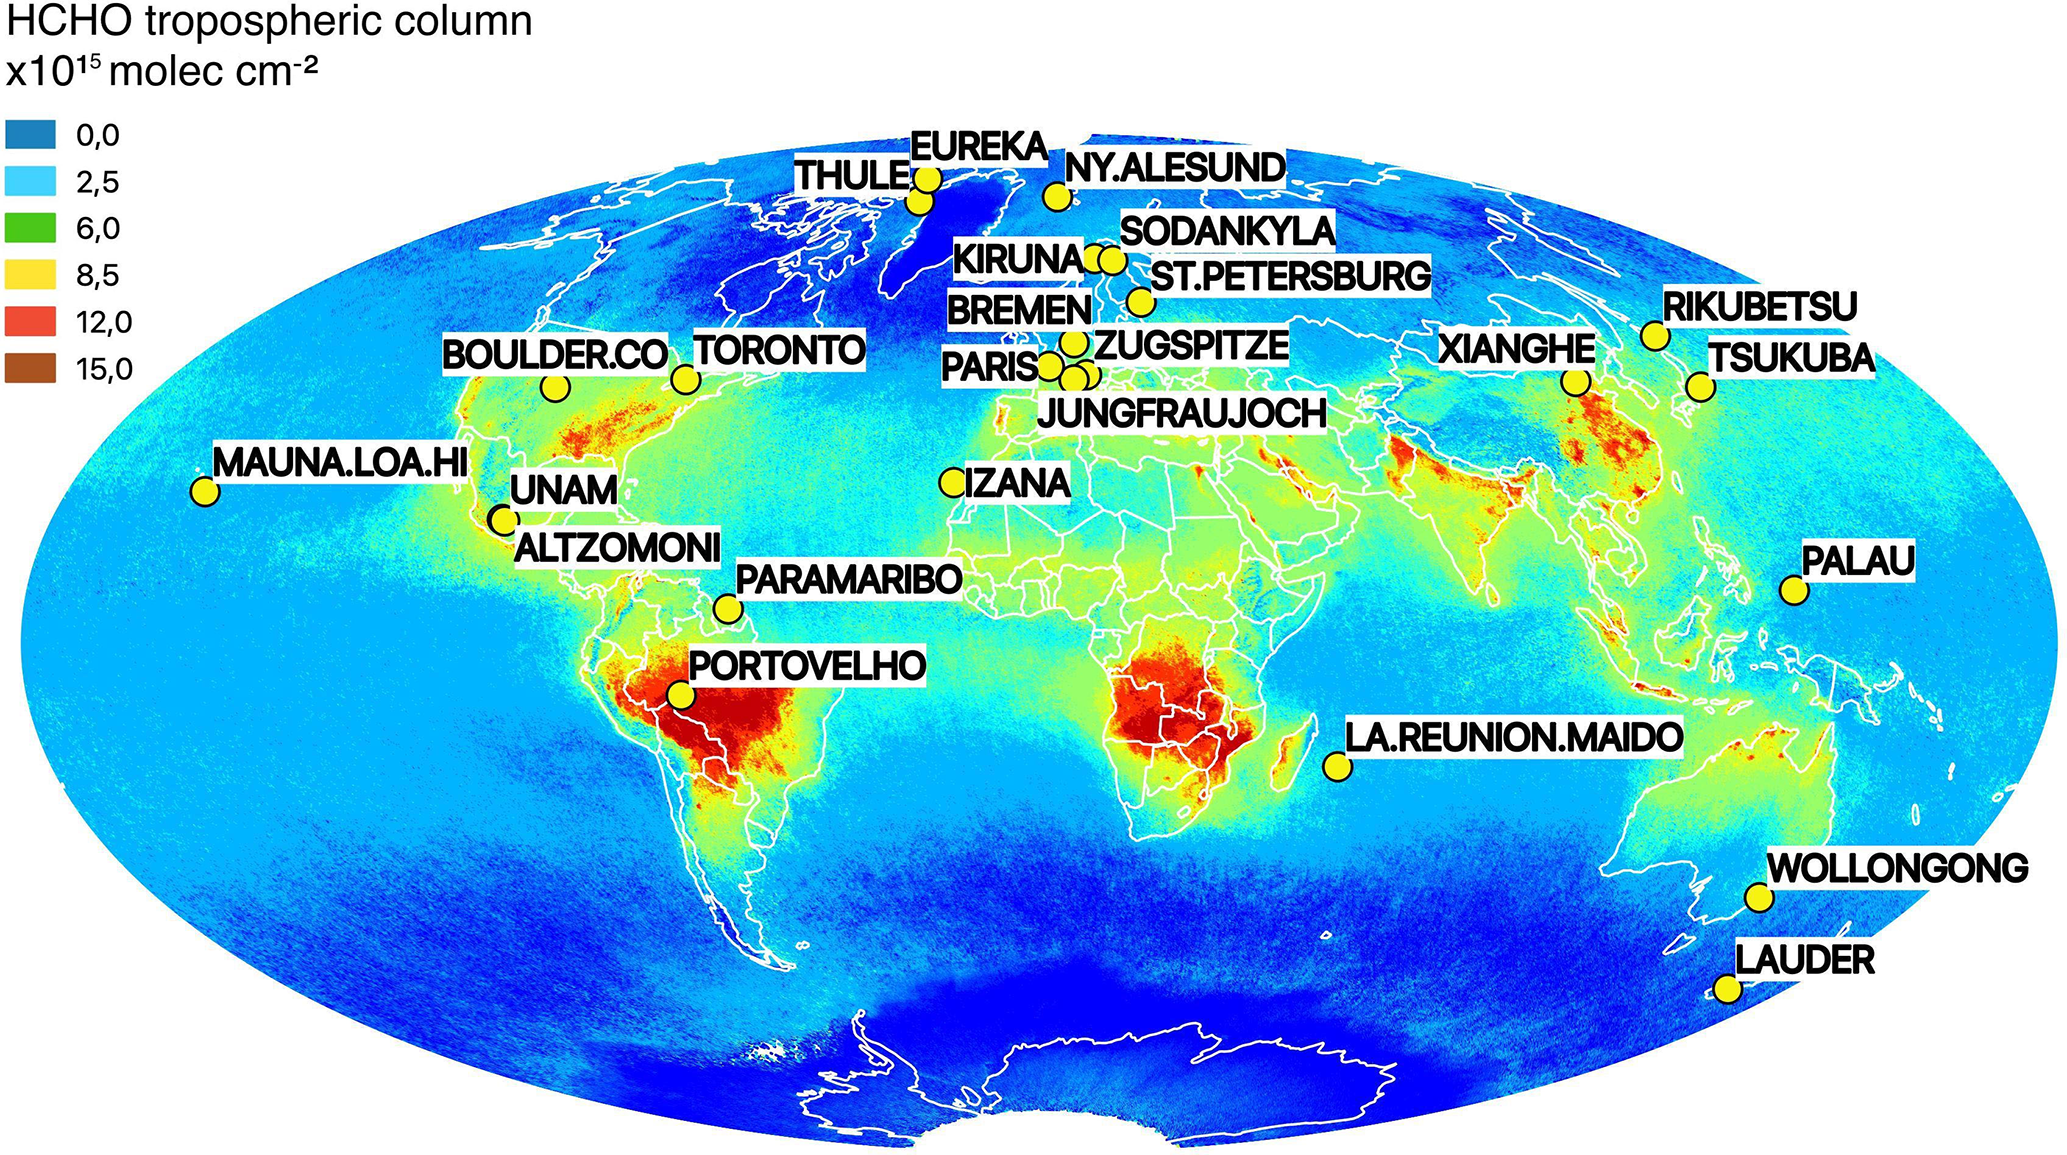
In view of the TROPOMI formaldehyde (HCHO) validation, BIRA-IASB has initiated and led the harmonization of the HCHO ground-based FTIR measurements across the network. We have been able to build a consistent HCHO data set including more than 25 stations over the world (see Fig. 1), covering clean air regions (Arctic or oceanic sites) and high emissions source regions (cities and forests).
Assessing the quality of the TROPOMI satellite measurements
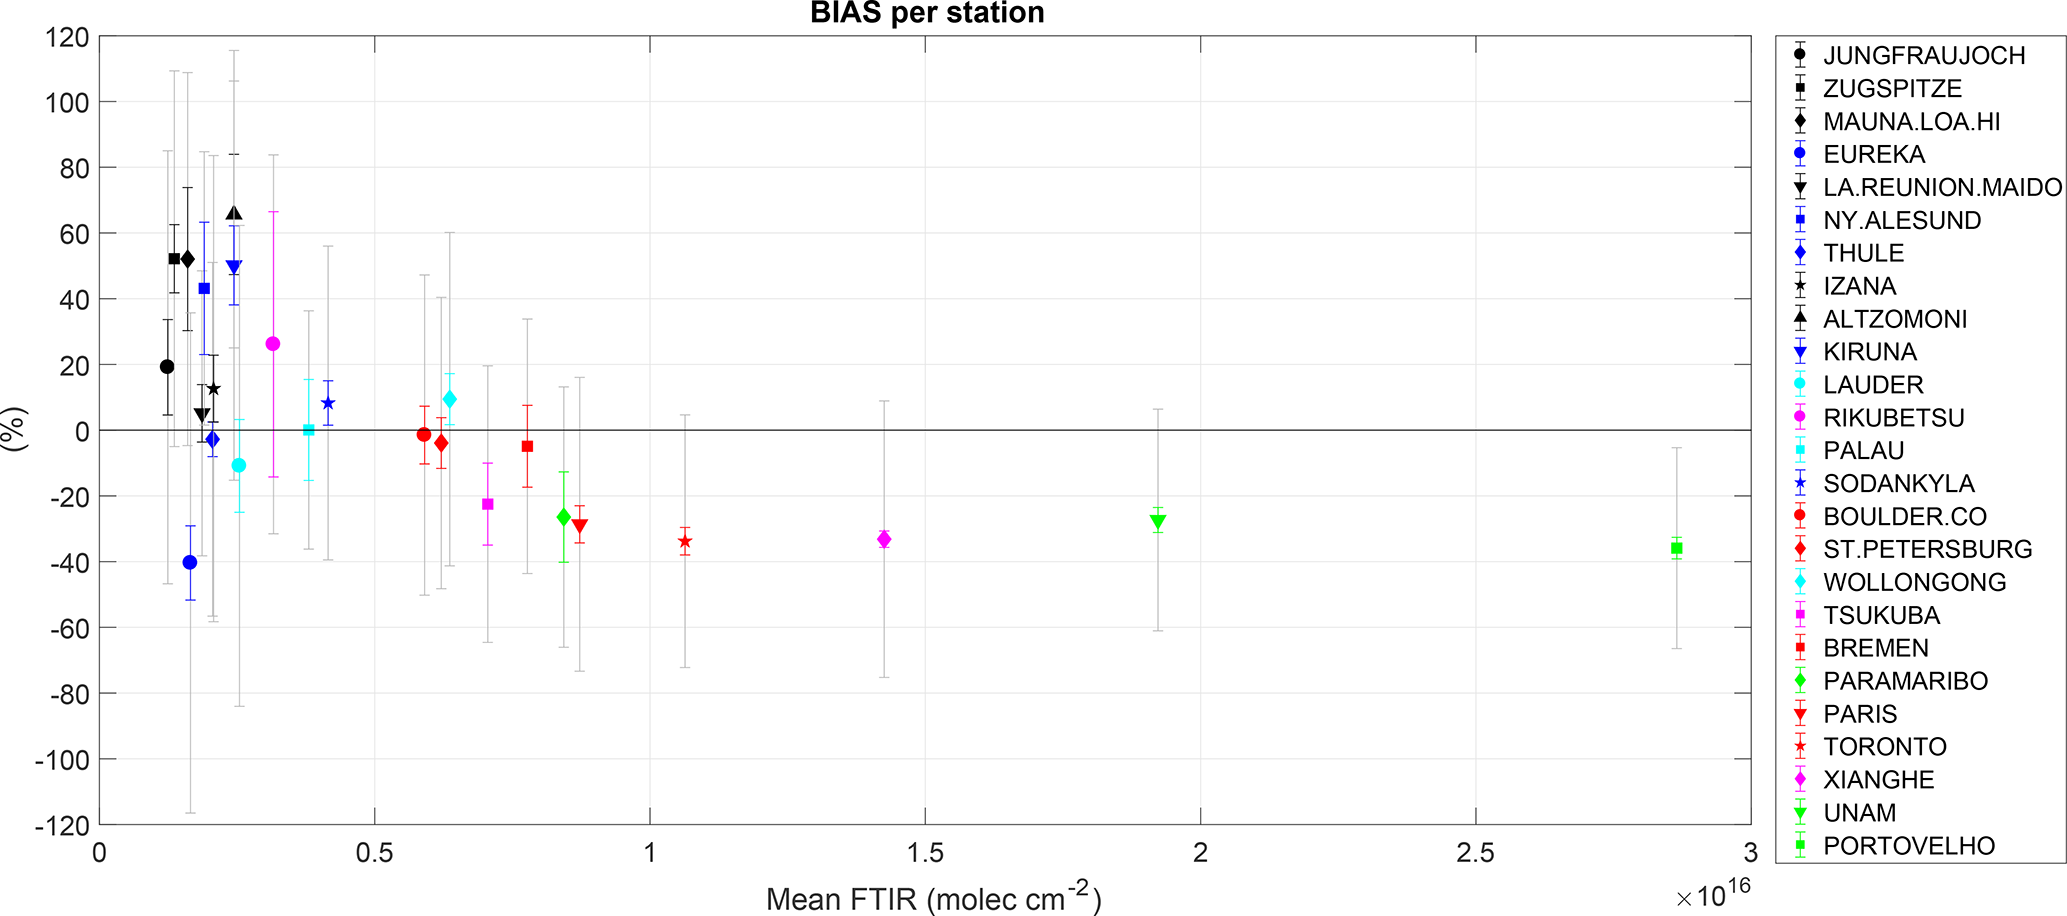
This ground-based HCHO data set has been used for TROPOMI validation and has shown very interesting results: TROPOMI is overestimating the HCHO amounts under clean conditions while underestimating them over polluted sites, as can be observed in Fig. 2. Such specific behavior of satellite data can only be detected by using carefully harmonized data sets from a globally distributed network.
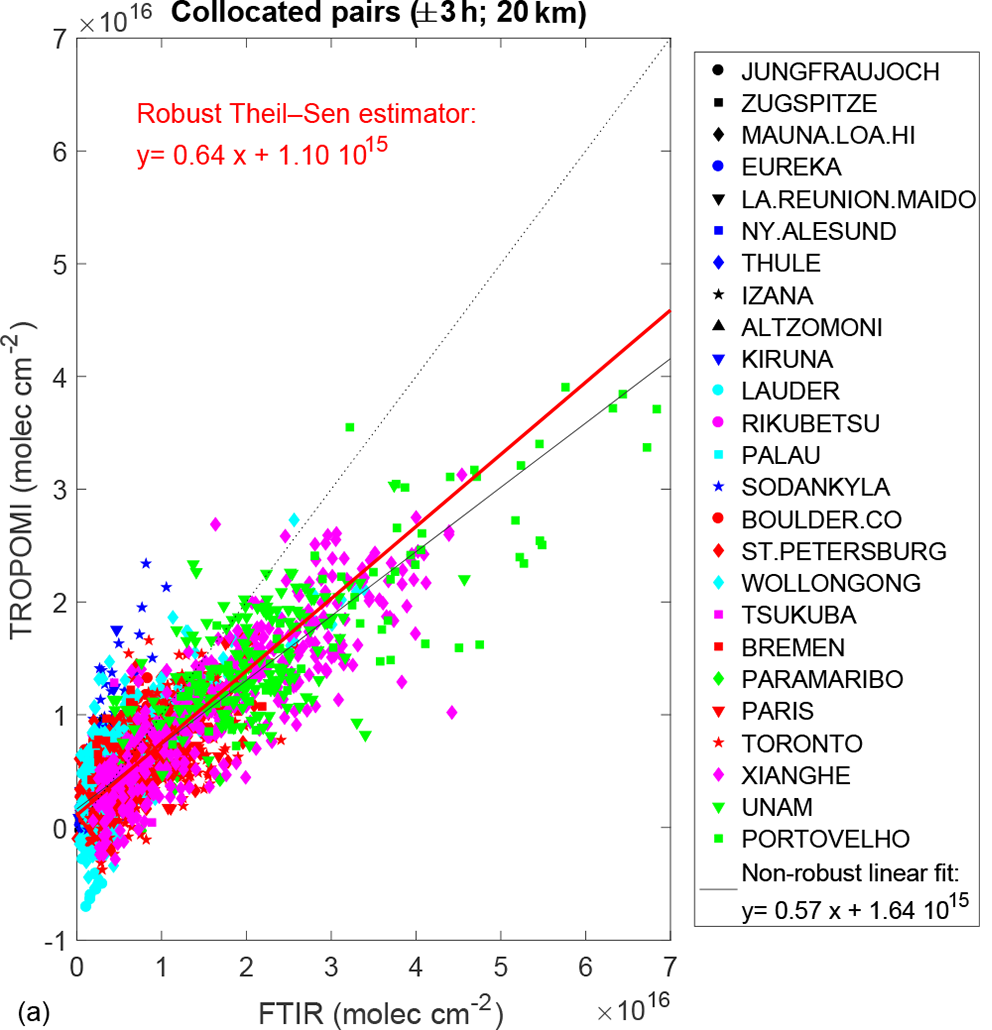
A robust linear relationship can be derived between the ground-based and the satellite measurements, as shown in Fig. 3. This linear equation can then be used to correct the satellite data at any place over the globe, which is crucial in inverse modeling studies that aim at improving our knowledge of HCHO emission sources.
References:
- Vigouroux, C., Bauer Aquino, C.A., Bauwens, M., Becker, C., Blumenstock, T., De Mazière, M., García, O., Grutter, M., Guarin, C., Hannigan, J., Hase, F., Jones, N., Kivi, R., Koshelev, D., Langerock, B., Lutsch, E., Makarova, M., Metzger, J.-M., Müller, J.-F., Notholt, J., Ortega, I., Palm, M., Paton-Walsh, C., Poberovskii, A., Rettinger, M., Robinson, J., Smale, D., Stavrakou, T., Stremme, W., Strong, K., Sussmann, R., Té, Y., and Toon, G. (2018). NDACC harmonized formaldehyde time series from 21 FTIR stations covering a wide range of column abundances. Atmospheric Measurement Techniques, 11(9), 5049-5073. https://doi.org/10.5194/amt-11-5049-2018

-
Vigouroux, C., Langerock, B., Bauer Aquino, C.A., Blumenstock, T., Cheng, Z., De Mazière, M., De Smedt, I., Grutter, M., Hannigan, J.W., Jones, N., Kivi, R., Loyola, D., Lutsch, E., Mahieu, E., Makarova, M., Metzger, J.-M., Morino, I., Murata, I., Nagahama, T., Notholt, J., Ortega, I., Palm, M., Pinardi, G., Röhling, A., Smale, D., Stremme, W., Strong, K., Sussmann, R., Té, Y., Van Roozendael, M., Wang, P., and Winkler, H. (2020). TROPOMI–Sentinel-5 Precursor formaldehyde validation using an extensive network of ground-based Fourier-transform infrared stations. Atmospheric Measurement Techniques, 13(7), 3715-3767. https://doi.org/10.5194/amt-13-3751-2020